Stop guessing why a mastery score moved. See the evidence in one click.

You’re prepping for a parent–teacher meeting. You open the report and see Liam jumped from No Mastery to Proficiency this term. Great news — except you can’t remember why. Was it a steady run of solid work across the topic? Or one lucky question on a quiet Tuesday afternoon? When the parent asks, "So how is he really going?" you need to know.
Until now, you couldn’t. Mastery labels told you where a student landed, but not how they got there.
The problem with mastery labels alone
Mastery levels are a useful shorthand. On their own, though, they’re a black box. A label tells you the destination; it doesn’t tell you:
• How many questions actually contributed to the change
• Whether the growth was broad and consistent, or narrow and fragile
• Which sub-skills they’ve nailed, and which ones they’re still shaky on
That gap matters when you’re planning your next lesson, justifying a report-card grade, or telling a parent what their child needs to work on next.
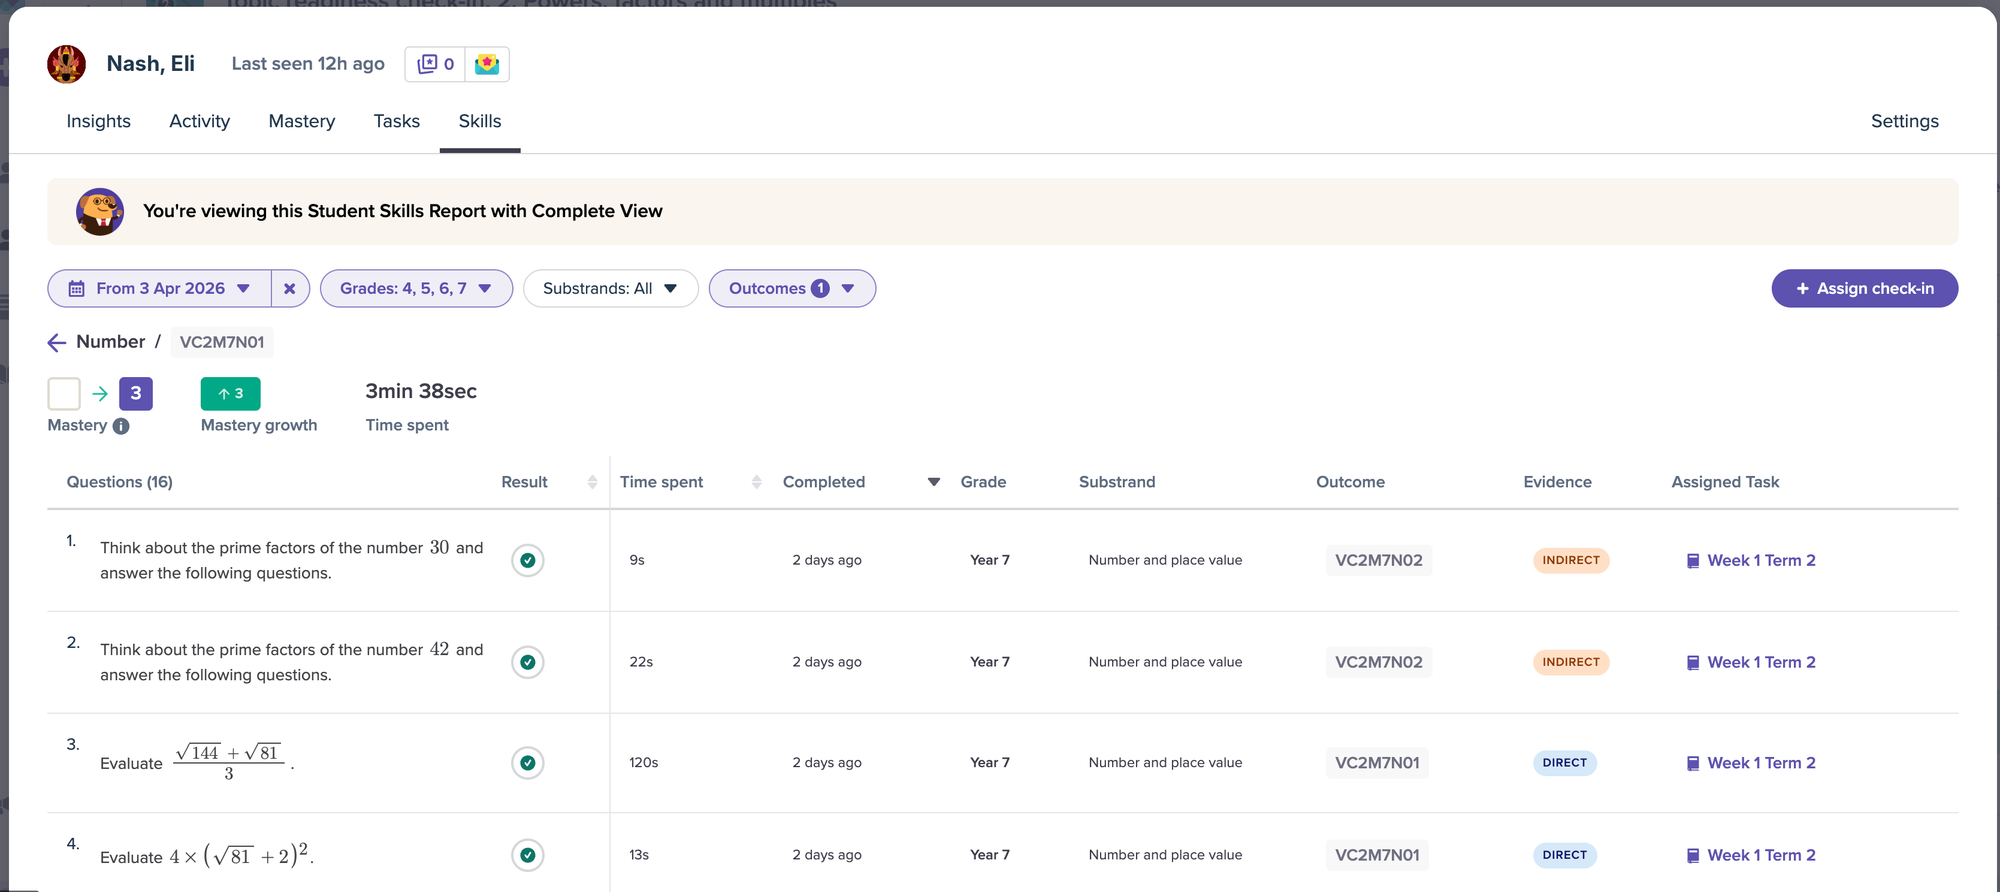
Now: click any cell, see the work behind it
Open your Curriculum report or Topic Readiness report and click any student’s result. Mathspace shows you every question that contributed to that mastery movement — the question itself, the student’s response, and whether they got it right.
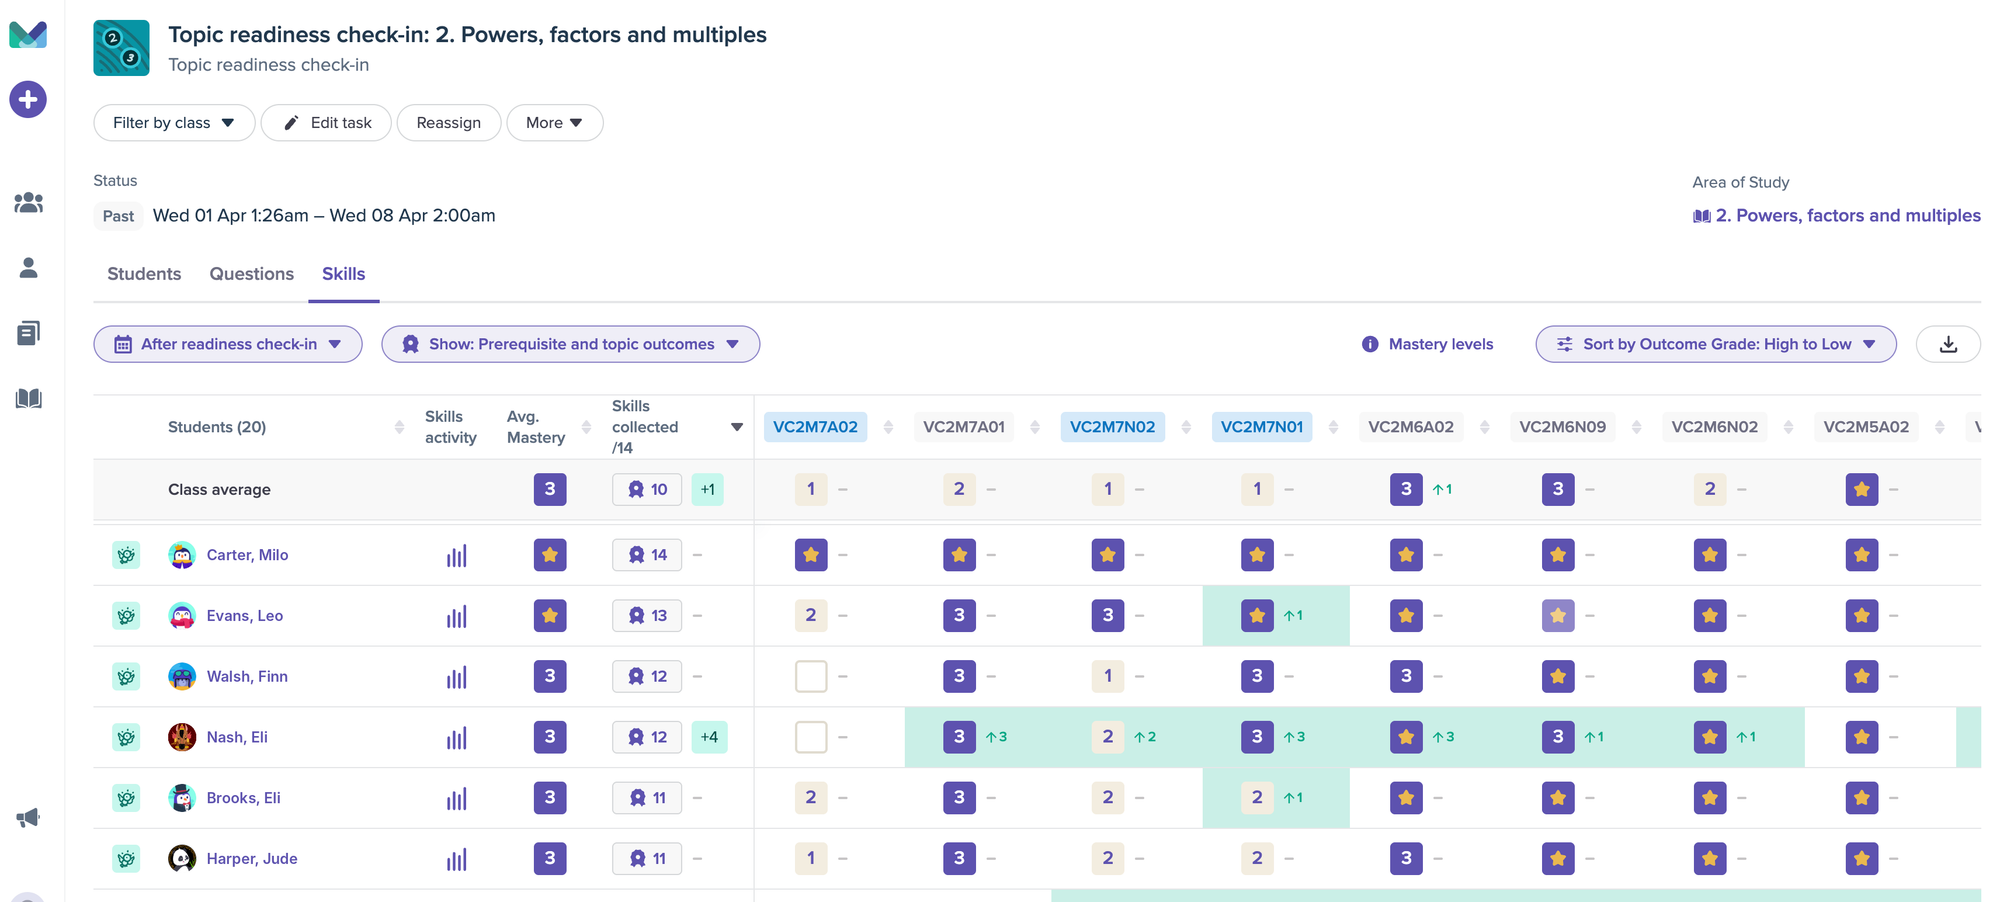
Everything is pre-filtered to the date range you’ve set, so you’re only seeing the work that actually moved the needle for the period you care about. No scrolling through weeks of unrelated activity. No cross-referencing tabs. Just the evidence, ready to read.
What this changes for you
Walking into parent–teacher meetings prepared. Instead of saying "Liam is tracking at Familiar," you can pull up the actual questions and show a parent exactly what their child can do — and where they’re still building. The conversation moves from defending a label to talking about what comes next. Most teachers say this alone is worth it.
Deciding whether to reteach or move on. Your class jumped from No Mastery to Familiar on quadratics — looks like a win. But click in and you might find most students answered just one or two questions correctly. That’s thin evidence. Now you can spot it in seconds and make a confident call: another lesson, or move forward.
Backing up data conversations with leadership. When admin asks how Year 9 is tracking, mastery labels can feel hand-wavy. Having the underlying questions and responses on hand turns a vague status update into a specific, defensible picture — the kind that earns trust and ends meetings faster.
Catching the student who’s quietly slipping. Sometimes a student sits at the same mastery level all term. Click in and you might find they’ve only attempted three questions. That’s not "stuck" — that’s "disengaged." It’s the difference between a content problem and a behavioural one, and now you can tell them apart at a glance.
Take the data into your own tools
Working in a spreadsheet? The CSV export now includes before-and-after mastery snapshots as numeric values. Sort by growth in Excel straight away — no more manually converting "Proficient" or "Familiar" into numbers before you can analyse anything. What used to be a 20-minute clean-up is now zero minutes.
The bottom line
You’re already doing the hard work — teaching, planning, communicating with parents and leaders. The data that backs you up shouldn’t be locked behind a label. Now, every mastery score is two clicks away from the evidence underneath it.
Less guessing. Stronger conversations. Better-informed teaching decisions.
For a step-by-step guide, see our knowledge base article: Using clickable report cells to view question-level detail